

Evolution AB: Equity Research & Valuation
- Azlan Khan
- Mar 30
- 28 min read

Updated: Sep 5

Evolution AB is a Swedish firm which acts as a B2B provider in the international gambling market. It innovates, produces, markets, and licenses content for online casino operators, a market within which it is a standout leader. It serves nearly 900 businesses and employs 21,000 staff across several continents. Founded in 2006 by Jens von Bahr & Frederik Osterberg, the firm went public on the Nasdaq First North Premier in March of 2015 before listing on the main market of Nasdaq Stockholm 2 years later. Its current market capitalization of €15.9bn represents an impressive 4600% appreciation on its IPO valuation. The parent company is based in Stockholm while Latvia and Malta serve as regions of central operation.
This paper aims to produce a comprehensive analysis of the firm.
Section 1 details how Evolution sells an immersive casino experience and what products make up its portfolio. It highlights the firm’s B2B model of strategic partnership and commission through customer earnings.
Section 2 maps the firm’s remarkable financial trajectory, with a 44% CAGR in revenues over a decade and margin expansion from 26% to 60% through exercising scale and operate leverage. We also find a robust balance sheet with minimal leverage and an efficient use of invested capital to generate returns.
Section 3 evaluates Evolution’s acquisition strategy. It demonstrates concerning metrics pertaining the high EV/EBITDA multiples at which acquisitions were conducted, with shareholder value at risk calculated at 25% for one example. Payback period for the premium charged is estimated at 12 years based on management synergy guidance.
Section 4 places Evolution within the transforming gambling industry, where it commands nearly 70% of market share. An industry map is plotted to reveal the relationships between major actors, regulatory bodies, and upstream and downstream channels. We examine how Evolution compares to its competitors and use return on capital metrics to gauge relative value creation.
Section 5 dissects Evolution’s competitive edge through value chain and five forces analysis. Game innovation, bespoke in-house manufacturing capabilities, and superior content delivery are uncovered as key advantages. We find high barriers to execution, with minimum scale economies and extensive pre-production costs setting a high breakeven threshold.
Section 6 employs a discounted cash flow model predicated on incremental rates of investment to estimate an intrinsic value at a 41% margin of safety. We highlight the current events which have caused the firm to trade at a historically low P/E ratio.
1: Business Model
1.1: Live Casino

Evolution is where studio-based production meets casino and gambling. The firm’s primary offering and revenue segment is “Live Casino”. A dealer operates a game from an actual table within an Evolution production studio. The game is streamed live to end users; players who log on from their personal devices and interact virtually both with the table and amongst themselves. The service offers players a realistic and engaging casino experience from the convenience of their homes. Live Casino is sold to and hosted on the platforms of various gambling operators1. Consequently, Evolution does not partake in any gambling operations of its own.
Evolution offers both “generic” and “dedicated” tables. Generic tables are not exclusive and hosts users from various operators. Dedicated tables are reserved for a specific customer, allowing them the rights to customize aspects of the game such as graphics, branding, background, bet limits etc.
1.2: RNG
Evolution’s secondary offering is RNG (random number generation) based games. These differ from live casino as there is no streaming or ‘real-time’ element. The experience is predominantly single-player and outcomes are predicated upon computer algorithms. As with Live Casino, RNG games are sold to and integrated onto an operator’s system. The games are largely standardized and there is no customization available.
1.3: Revenue Composition
Evolution is solely a B2B provider, maintaining strict separation between its obligations as game and technology provider and the operating role of its business customers. The operators are licensed casinos which oversee user deposits and withdrawals, account authentication, player interactions, and house winnings.

Accordingly, most of Evolution’s revenue is derived from the commission charged on the earnings of casino operators. This applies to both Live Casino and RNG offerings. Hence, the business model relies on a close and strategic partnership with customers whose financial health reflects upon Evolution’s performance. This exposes Evolution to the general growth of the online casino market.
Considerable revenue is also generated in the form of monthly fixed fees paid for dedicated tables. These are used exclusively for the operator. The fee depends on the complexity of agreement, extent of use, and degree of customization. For example, operators may demand the dealer be able to speak the native language of its geographical region. Smaller costs for the set-up of such tables are also invoiced upon initiation.
1.4: Cost Structure
The majority of the costs incurred by Evolution are related to personnel. These are staff involved in direct operations as well as those within IT and software development. Noticeable costs are incurred in the training and recruitment of skilled dealers through Evolution’s own ‘Evolution Academy’.
One-time fees arise through the development of production studios to increase capacity. New games are released every year and so innovation costs are charged through both operating expenses and the depreciation of capitalized intangible assets.
1.5: Game Portfolio
1.5.1: Casino Classics
Within Live Casino, the firm’s cornerstone products have been the standard games of roulette, blackjack, baccarat, and poker, listed in order of decreasing share of Live Casino revenue. These classics fall within the public domain and accord Evolution no intellectual rights. However, Evolution has produced various reinterpretations of these games which they license as their own. In 2017, the firm applauded its variant ‘Lightning Roulette’ as the fastest growing game in its history. In the same year, rapid success of a newly launched ‘money wheel’ based game led the firm to create the entirely new category of ‘Live Game Shows’.
1.5.2: RNG
Most Live Casino games are also available to play in the single-player format. In the absence of dealers, algorithms are used to generate computerized results. The significance of this offering lies in its ability as a cross-selling tool, introducing RNG familiar players to the firm’s more profitable Live Casino system. Slots first appeared in the firm’s portfolio when it acquired NetEnt in 2020; another B2B provider within the online casino market (but crucially, not the 'live' casino market). Slots are digital renditions of machines comprising of 3+ reels (vertical columns) with rotating symbols. Notably, slots are not a historical component of Evolution’s core competency.
2: Historical Performance
2.1: Revenue & Growth Figures
2.1.1: Growth
At the end of 2024, Evolution reported total operating revenues of €1,776 million. Over the past 8 years, the compound annual growth rate in such revenues has been an impressive 44%. This figure climbs even further when growth is observed at an exchange-rate neutral basis. However, progress in recent years has not been as spectacular. As seen in the table below, 2024 sales represented the smallest year-on-year growth since the firm’s IPO.

This may be partially explained by the introduction of RNG offerings in Evolutions portfolio since the acquisitions beginning 2020. The market for online RNG is bigger, more saturated, and hence expanding at a slower pace (see section 4.1). It is worth mentioning that the 17% climb in RNG revenues in 2022 is largely explained by inorganic growth. Another striking figure is the near doubling of the top line in 2021. Some of this progress can be attributed to COVID-19 related lockdowns, giving online casino, and by extension live casino, and edge. However, more significantly, we can infer from the disparity between live and total revenue growth that the outlier represents inorganic revenue accretions from Evolution’s first (and largest) RNG brand acquisition.

An insightful exercise is to view growth rates in respect of the revenue’s geographical region. Europe, Evolution’s initial and oldest market, has seen a dramatically reduced rate of expansion since 2022. Given this is most saturated market observing the highest online casino penetration levels, these figures are predictable. However, there is still much capacity to be filled, and Evolution’s management team have communicated on several occasions their struggle to meet quotas in Europe.
Overall performance has been picked up by the emerging markets of Asia and South America, along with the newly regulated markets of North America. We can expect these regions to be of central importance in the years to come. Asia’s lacklustre 2024 compared to the year prior is due not to shortfall in demand but rather prevalent cyber-attacks and unfavourable regulation. In fact, interest in Live Casino is higher nowhere else, and significant customers are onboarded through mobile as the primary distribution channel.
Undoubtedly, Evolution has been a rapidly growing business. However, a more telling evaluation of core performance can only be conducted through comparison with industry and sub-industry growth figures, as we accomplish in section 4.
2.1.2: Growth Drivers
There are three primary methods by which Evolution can see rising revenue. First, it may charge higher commission on operator earnings or higher recurring fixed fees for dedicated tables. Second, the operators may see their earnings rise, either due to firm-specific reasons or general industry growth, which represents an absolute increase in Evolution’s royalty. Third, the total number of customers provided to may increase. Finally, Evolution’s mix of products sold may sway towards more profitable offerings.
Unfortunately, we cannot comment as to how much of an impact the first driver has had. Evolution’s filings are reticent in conversation’s surrounding commission charges (this will also be a serious shortcoming in gauging Evolution’s pricing power) and perhaps so for competitive reasons. Nonetheless, it is difficult to imagine that the successive compounding of the top line can be attributed largely to price hikes.
It is obvious that the second and third drivers are more significant. The prior decade has allowed the online casino market much room to grow, and by extension, room for Evolution’s absolute commission. The number of buyers has also jumped significantly (see table 4 below). Notably, the share of increasing operator earnings has not been evenly distributed. Table 3 reveals Evolution’s dependency on its top 5 customers. Viewed together, we understand that significant customer growth until 2022 exerted downward pressure on the share of the top 5 purchasers. By virtue of this growth slowing in the subsequent years, as well as (some) consolidation in the online casino market, the shares of the largest buyers have risen back to post IPO levels (this data is crucial for understanding buyer influence as a part of competitive analysis - see section 5.2).

It is the author’s opinion that the fourth driver is most pertinent for future forecasting (it is not the most significant explanatory variable but rather most difficult to forecast). Product mix can be explored both within Live Casino and across itself and RNG. With the former, we are referring to the prevalence of generic compared to exclusive tables. In the early post-IPO stages, operators recognized the value added with a customized table. When operators elect to purchase a dedicated table, the impact on revenue is manifold. They would have to purchase a single table for each game (e.g. live blackjack, live roulette) that they would like hosted onto their platform. We can follow mathematically by observing the number of tables per customer across the years (see row 5 in table 4 below). Until 2018, the number ascends from 1.9 per customer to 2.8. This trend in tables per customer is more important when accounting for operating leverage. Across its lifetime, evolution has pushed to innovate games that are infinitely scalable (i.e. number of plauers per table is restricted not by nature of the game but server capacity). As these games are released and popularized, lower number of tables are required for a given number of users. We would expect this to pressure the number of tables per customer downwards. Given that the ratio rose by 0.7 despite this fact, we can deduce that the demand for dedicated tables was considerably strong!
In the three subsequent years, the unprecedented growth number of customers pushes the ratio downward. Observing these numbers in conjunction with geographic growth as expressed in table 2, we can deduce that many of these customers were acquired through Evolution’s expansion into the emerging markets of Asia and Latin America. These are more fragmented regions and see a greater proportion of smaller online casino operators relative to land-based ones. Hence, they may have elected against the expensive exclusive tables.
Product mix also significant across RNG and Live. RNG services are sold for smaller sums and bring in lower margins. They also grow at significantly slower pace. Leaving aside the potential for further acquisitions, future top-line growth will be impacted by the ratio between RNG and live.
2.2: Costs & Margins
2.2.1: Costs
Evolution’s business is scalable. The marginal cost to sell an offering to one more customer is minimal and vague. In the case of selling a generic table or a license to an RNG game, the cost in negligible. With regards to dedicated tables, while it is easier to point towards the general costs incurred, portioning out fixed aspects such as broad studio costs, variable aspects such as dealer wages, and the myriad of spend associated with customized table manufacturing is difficult. Furthermore, if costs of sales were to cover only this aspect, then it would distort the true marginal cost of generic offerings. Accordingly, Evolution employs no metric of cost of sales and defers the aforementioned items to operating expenses. This is common among firms functioning within knowledge sectors.
Table 4 exhibits the changing proportions of operating costs over time. As with many ‘knowledge’ firms, personnel costs eat up a large share and have remained at least 50% of Evolution’s total operating expense since 2015. These costs include those for operating and development staff as well as senior management. Any staff cost attributed to internal development or research that results in capitalization as an intangible is stripped from staff costs and ascribed to capital expenditure. Furthermore, these costs as expressed on the income statement do not include stock-based compensation. Hence, gross or ‘true’ staff remuneration is slightly higher.

The ascent in the depreciation and amortization of capital is explained by a rise in capital expenditure disproportionate to income. This does not, however, imply that personnel costs have decreased in absolute terms, nor does it grant us any information pertaining to the cost per employee. Seeing as these charges make up half of the expense invoices at any given time, it makes sense to examine them further.
Table 5 shows both gross earnings and cost per employee since 2015. Evolution has a high proportion of part-time workers, and so the number of employees were recorded at “full-time equivalents”. Note that the position of the bars (revenue) relative to the line (costs) are not to scale, and the two measures refer to the left and right Y-axis respectively. Cost per employee is perhaps the most useful KPI to track, and especially so when considered in conjunction with the timeline of Evolution’s geographical expansion. Until 2020, Evolution was able to service more customers per employee. Despite constant hiring, costs bottomed in 2021. The four subsequent years saw greatest efforts made in North America. This included both American and Canadian states. These countries demand higher minimum wage rates in real terms, translating into a higher cost per studio for Evolution.
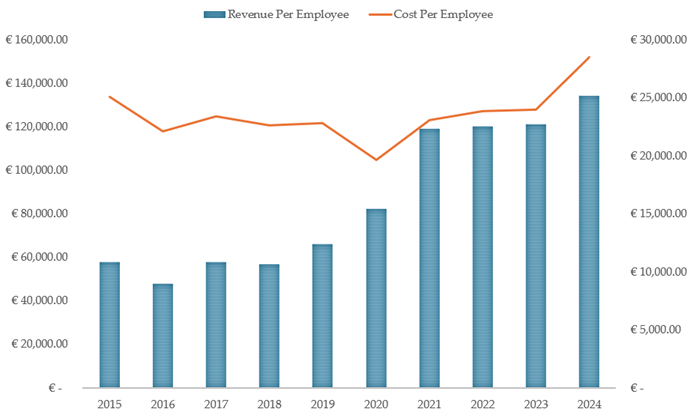
It is also important to recognize that Evolution’s number of employees are greatest in the US when considered relative to total revenue attributable to the country. Here, we may have our first meaningful discussion about regulation and the influence it holds over the gambling industry. In the US, as with some other countries, Evolution is required to open local studios to serve operators. This has at times extended to each individual state. The result is a greater number of expensive workers in the country.
2.2.2: Margins
Evolution geographical footprint in the US, at a state level, is limited. Recognizing this, as well as the points made above, we can make sense of trends in margins over time and make reasonable predictions for the future.

Figure 5 demonstrates striking results. Evolution’s ability to increase margin’s year after year in rapid succession, and do so in a consistent manner, speaks to the strength of its business model. It’s lowest ever net margin of 26% would be considered strong, though the figure more than doubled past that in 10 years. The driving force has been operating leverage and scale economies. Overtime, the firm released only those games which were not limited by a set number of players per table. Instead, the limits were delegated to regional traffic and server capacity. Revenue per table increased year-on-year without any simultaneous costs.
One point of comment is the minimal gap between net and operating margin. This is due to Evolution having historically carried little to no debt. Their interest coverage ratio is high within and amongst industries. As a result, it enjoys cheaper debt to the extent that it has any. Furthermore, Evolution has benefited from a remarkably low effective tax rate of roughly 6%. In 2024, a change in Malta’s tax code pushed this to 12%, explaining why net margin has lagged operating margin in 2024. The trajectory of FCF margin is no less impressive (The FCF metric used here is ‘Free Cash Flow to the Firm’(FCFF). Typically, repayment of lease liability would not be included in this calculation. However, Evolution’s leases on their studios represent, for the author, the cost of running an operational asset. Hence, this figure has been netted out). 2017 and 2021, forming the two ‘bows’ on the graph, are a result of significant spikes in accounts receivable (aggressive selling on credit).
Understanding by the now the cost composition of Evolution, as well as the impact of further studio expansion the two North American countries, we can expect that higher wage rates may act as a counterforce to any further gains in cost efficiency. Management has indeed given reduced guidance for future EBITDA margins. However, they cite cyberattacks in Asia as the main factor.
2.3: Financial Health & Return on Capital
2.3.1: Cash & Debt
Evolution has historically enjoyed a robust balance sheet. It avoided debt on principle, and nor was it a necessity given the power of their operating earnings. Figure 6 shows the firm has built a large cash stockpile which peaked in 2023. However, we need to explain how and why debt has accumulated since 2020.
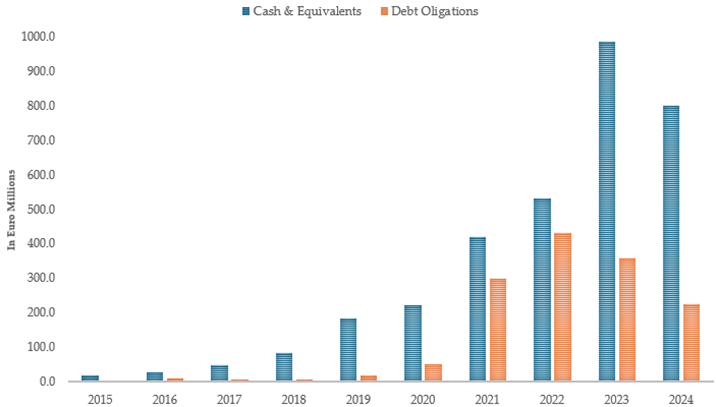
Evolution rents most of its studios. These appear as lease obligations on the balance sheet given IFRS rulings. Naturally, as the firm expands to new markets and sets up studios, the amount of lease liability outstanding will increase. Indeed, higher interest payments on these leases have been one reason why net margin has lagged operating margin in the past two years (see figure 5). However, the major components of this debt are “earnout obligations”. When Evolution acquires a large firm, it typically pays a portion of the funds required in cash and qualifies the rest on future profitability of the new subsidiary. The maximum earnout (or the amount Evolution believes it will likely pay) is listed as a financial liability liable to future revisions. We can see these earnouts peak in 2022, after which the absence of further major acquisitions and earnout payments has started to bring debt levels back down. Crucially, this is not long-term debt upon which Evolution pays any interest (save for any indexation clause to protect real return), and so liquidity and interest coverage are not negatively impacted.
2.3.2: Capital Composition & Return
Evolution’s filings show they have spent three times more on intangible assets compared to physical. This relationship excludes goodwill, which of course is larger than both combined. Intangible assets are concentrated amongst gaming programmes (software based), brand, customer relationships (only for acquired brands measured at transaction cost), and to some extent, licenses (e.g. those administered by regulatory bodies to operate within a jurisdiction). As for physical assets, Evolution owns limited land and property. Rather, the vast majority of tangible asset value is credited to right of use assets (mostly studios) and office/technical equipment.

Evolution’s capital intensity has decreased considerably in the past decade. Whereas the firm would invest over half its operating income in 2015, this has hovered around 10% more recently. Of course, actual capital expenditure covering both tangible and intangible assets has increased significantly. Net capital expenditure (spending excess of maintenance capital expenditure) has been positive with some fluctuation. This is the mark of a growing firm transforming its efficiency as it progresses.

Evolution’s return on invested capital has delivered consisted clear of its cost of capital. The firm is clearly generating value. The author’s calculation of WACC at 10.76% is slightly higher than some of the figures being quoted across other sources. The equity risk premium was calculated as a weighting of proportion of sales per geographic region/country. Regions such as Georgia where Evolution holds significant operations have a high such premium. Earnout liabilities on the balance sheet were not factored into the D/E ratio given they bear no interest. The firm is then funded mostly by equity, and a high cost of equity translates into a high WACC.
Pricy acquisitions in 2020 and beyond brought large values of goodwill, limiting ROIC substantially. This fact coupled with further discussion below reflect poorly on management’s decision to pursue these acquisitions, and especially to fund them through share dilution.
3: M&A Transactions
3.1: NetEnt
Between 2020 and 2022, Evolution made three major acquisitions of slots brands to add an additional vertical to their offering. The strategy was to enter the much larger online casino market segment of slots and achieve synergies through their comparable B2B operations.
This section analyses the most significant acquisition, that being the first purchase of NetEnt in December of 2020. Total consideration including the purchase price, compulsory debt redemption, and redemption of outstanding warrants came to € 2.36 billion. Over 90% was paid for with Evolution shares, representing a significant level of dilution. The acquisition itself was expensive with the estimated EV/EBITDA multiple being 20x. Minimum guidance for anticipated annual synergy was € 40 million a year achieved through cost savings. We can calculate Shareholder Value at Risk (SVAR) (imperfect metric as we assume the market capitalization was fairly priced to begin with) as:

Using the minimum guidance on cost synergies, we can estimate:

This sets serious expectations for value creation through synergy at a considerable risk of shareholder value destruction. Such expectations were not met. In light of RNG’s mid-single-digit growth over the past few years (see table 1) compared to management’s double-digit aspirations, these acquisitions have been dubious at best. Future acquisitions past NetEnt were just as expensive, though dilution was circumvented through cash purchases. There are indeed chances of improved future performance through delayed synergy, but it is perhaps in the best interest of shareholders that management stick to organic growth for the foreseeable future.
4: Industry Landscape
4.1: Gambling Sector
Evolution operates in a niche yet fast-growing sub-sector of the gambling industry. Gambling, which broadly refers to any activity wherein money is wagered on uncertain outcomes, can be engaged in either online or at a physical location.

Online casino is a subset of online gambling which refers to more traditional casino-style games as opposed to sports betting etc. This would include slots and other similar RNG based experiences. Evolution’s competency, live casino, is then the final branch where casino-style games are played live and streamed to all users concurrently. The makeup of the overall industry has changed dramatically over the past few years and is forecasted to continue to do so.

Online casino has grown significantly faster than land-based and is projected to continue at a CAGR of 11.43%. Live has been the fastest growing segment of online at a pace of 20 – 30%. In fact, land-based is not only losing market share but is forecasted to contract onwards of next year. Its claim over the market will fall from 76% in 2020 to 58% by 2029. Evolution is then positioned well in the most promising segment and can expect to at least match the live market’s rate of expansion, if not outperform as it has been doing.
4.2: Industry Map
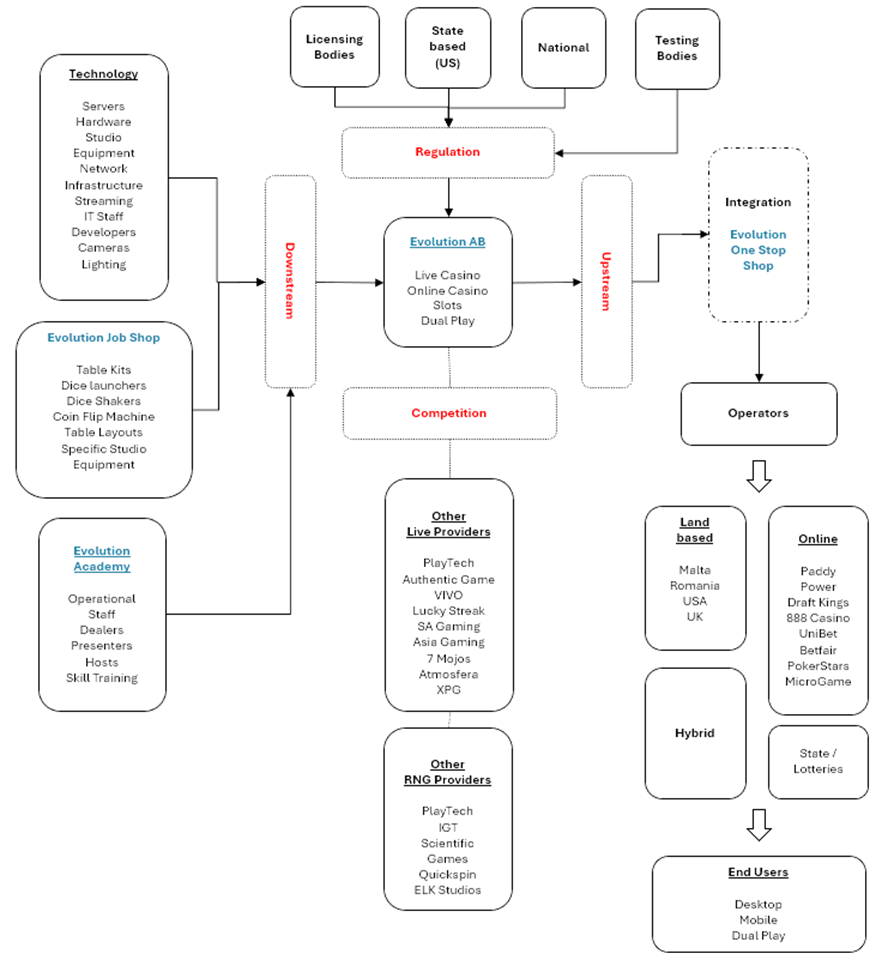
Figure 11 provides a holistic overview of the key actors and attributes of Evolution’s segment. Interaction within this picture will be useful to keep in mind as we delve into the four key aspects of regulation, competition, and upstream and downstream channels.
4.2.1: Regulation
Evolution’s exposure to regulation is distinct and reduced compared to that of its operators. Operators bear the primary burden of compliance relating to all things player centred. As the B2B provider, Evolution has to obtain licenses and certifications per jurisdiction and pass technical audits of their game mechanisms and fairness.
A discussion on testing and licensing assumes however that the market is regulated to begin with. This is a point cardinal to Evolution’s operations and future outlook. An unregulated market is a gambling grey area; there are established legal frameworks for live casino, and sometimes even online casino in its entirety. Evolutions policy is to serve licensed operators in general, but these operators may and do serve various unregulated markets. Many regions have made the move in recent years to establish some rule of law. This is generally a welcome development as it offers Evolution greater certainty going forward. Conversely, there is no guarantee that the new rules will be favourable to Evolution. At minimum, they would begin paying license and gaming fees/taxes. This understanding will be crucial to our forecasting and valuation as we predict where the effective tax rate may settle. A detailed discussion on regulatory risks can be found in section 5.3.
4.2.2: Upstream & Downstream Channels
Within the live segment, the central operating inputs are data centres & server capacity, film equipment, software developers, physical materials for tables and props, and skilled operating staff. Considering Evolution’s pre- and post-production network, it is vertically integrated to a considerable degree. In 2020, it launched its “job shop”; an in-house boutique manufacturing facility which would endure the burden of producing Evolution’s more bespoke live casino material needs. Given their catalogue of original games, there is often a requirement for idiosyncratic dice launchers, coin machines, gaming table specifications etc. Downstream integration does not extend simply to manufacturing. Not long after their IPO, they announced “Evolution Academy” as a training facility for dealers, presenters, and the like. This was essential as Evolution often came short on required operating staff numbers that possessed the requisite skillset.
A larger part of Evolution’s customers are those that are themselves wholly online. More recently, land-based operators have come to realize the value in offering live experiences. In some instances, evolution may set up a studio on the premises of the operator itself, as it has done in some US states. This offers the chance of dual play, where online players compete with those at the location physically. Given Evolution runs no casino operations of its own, the upstream question is one of software integration onto operator platforms. Around 2021, Evolution unveiled its “One Stop Shop”, a platform that integrated all of their RNG and live offerings onto one medium. This functioned both ways, as rollout of new products to face customers was faster, and operators could rely on just on method and programme to buy and host games.
4.2.3: Competition
It would not be an exaggeration to say that Evolution has no comparable direct competitors - the few that may qualify are small and private. PlayTech is its closest match; an online casino provider based in the UK, and roughly one-tenth the size. While its B2B operations are significant, it also owns a casino operator in Italy which accounts for a decent share of revenue (this subsidiary is set to be sold in the coming months). Hence, its business model is not ‘pure software provision` as is the case with Evolution. Revenue from operations is subject to lower margins, and as we understood from industry growth rates above, will not keep pace with Evolution.

The impact of this can be seen in the figure above. Apart from PlayTech, the three other firms are direct competitors in the slots segment. Evolution and Light & Wonder are the only two firms to have created value in 2024. Only Evolution’s business model, with its scale, capital efficiency, and negligible marginal cost, allows for such outperformance. As a result, any relative valuation on the basis of P/E, PEG, or other such multiples would be ineffective and shed little light on the expectations baked into the two firms.
Evolution has displayed sustainable value creation over the course of its life, and such value creation is the signature of competitive advantage. We will unpack this advantage in the section 5 below.
5: Competitive Analysis
This section’s competitive analysis of Evolution will focus solely on the live casino segment. It is the author’s opinion that Evolution holds no durable edge in its RNG operations, and nor is it likely to in the future. RNG’s historical growth and margins as well as industry fragmentation betray that fact. This should impact our overall assessment of the firm, but to a muted degree: RNG’s share of revenue has fallen from 27% to 16% in four years and will continue to drop as live casino outpaces it. Its analysis is not material.
5.1: Value Chain
Figure 13 depicts sequential stages within a live casino business model. Here, our aim is to analyse each of the five discrete “activities” as performed by Evolution to capture their competitive advantage.

5.1.1: Game Innovation
Live casino firms cannot rely on traditional non-copyright games within the public domain. They must develop variants to obtain exclusive patents and attract end-users. This first stage is where evolution excels most clearly. In 2021, it had been crowned the EGR (eGaming Review) live casino provider of the year, for the 12th consecutive year since the award’s inception. This award is accorded based on, among other criteria, the quality and playability of a supplier’s innovated games.
We can further infer Evolution’s edge within this stage given the popularity of their innovated variants compared to the core games. Their most popular games such as Lightning Roulette & Monopoly Live were developed in-house. Both offerings won EGR Game of the Year awards in 2014 and 2019 respectively.
Finally, Evolution’s competitors, both public and private, offer a host of casino products of which live is only one part. Their attention is apportioned across industry segments whereas Evolution concentrates on one area. In 2024, Evolution’s share of live casino market was estimated to be between 60 – 70%. This pegs them as the incumbent monopoly within the segment.
5.1.2: Studio Infrastructure
Evolution is the only live casino provider with an in-house manufacturing capability. Vertical integration not always the answer, but in this case, it has served the firm well. Developing bespoke game variants requires bespoke physical infrastructure. Evolution’s Job Shop, formalized in 2020, produces items “no one else in the world can supply”. The team in-charge benefits from direct communication with the game development team which can relay the exact specifications demanded.
For instance, their automatic dice shakers for certain games exhibit 80% fewer “on edge” errors. This translates directly into an attractive gaming experience. The facility also allows Evolution faster access to critical items. There is reduced chance of stock-outs as availability can be tuned based on forecasted game popularity. Since the launch of Job Shop, the firm has been able to release games at a much faster rate while not sacrificing on quality.
5.1.3: Content Delivery
Live casino is far more complex than placing a camera in front of a table. The real-time operational demands for game delivery are intricate and onerous.
Multiple high-definition cameras capture various angles which interchange throughout experience. Software is required for real-time video encoding to maintain stream quality while simultaneously minimizing latency. Optical Character Recognition systems monitor the movements of the dealer e.g. detecting card values such that they may be accurately displayed on the end-user’s heads-up display (HUD). Coordination between the HUD and the physical table must be perfectly synchronized such that users can raise actions as game states arise. Any error, whether in latency, stream-quality, or dealer actions would nullify the entire game.
Evolution’s Mission Control Room (MCR) grants them the ability to oversee all the aforementioned requirements. The facility operates 24 hours a day, monitoring for technical issues while maintaining backup feeds in case of any faults. It has also constructed a personalized video coding solution to guarantee continuous HD streaming. System availability was 99.93% in 2023 and has been consistently at this mark for years. For this reason, Evolution’s games provider a more attractive and uninterrupted gaming experience, maximizing user retention. This incentivizes operators to partner with Evolution over other providers which accords mutual benefit.
5.2: Porter's Five Forces
5.2.1: New Entrants
The barrier to entry within live casino is moderate, but the barrier to execution is high. Capital requirements for studio and technological infrastructure is high. Furthermore, providers need to develop a catalogue of games to entice operators, as they will want to offer end-users more than one experience. Hence, pre-production costs are exceptionally high, and entrants need to serve multiple operators to breakeven. The threshold for minimum efficient scale (smallest level of production required to minimize costs) is challenging to meet. The margin for error is low and so sourcing or training skilled croupiers is crucial.
The barrier to entry within unregulated markets is lower. There is no need to be licensed by an appropriate body, nor is there stringent auditing of gaming algorithms. The lack of gambling taxes may allow entrants in unregulated markets to undercut Evolution’s prices. However, across the globe, such markets are on a trend towards some form of regulation. Hence, new entrants will find it harder and harder to exploit a lack of regulation over time.
5.2.2: Supplier Power
Suppliers possess little to no bargaining power. Asset specificity is low across most inputs and can be sourced from various vendors. For those inputs that are bespoke, manufacturing is conducted in-house and reliance on external provision is minimal.
5.2.3: Operators
To date, no operator served by Evolution has decided to terminate their partnership in favour of in-house live casino provision. It is beneficial for the operators to rely on Evolution in the live casino space given assurances of quality and consistency. There is also an element of lock-in, where those costs to customize and set-up dedicated tables are sunk. Beyond that, switching to another provider would incur charges to integrate the new instance with the operator’s platform. If operators were to ever cease partnering with Evolution, probable cause is much more likely diminishing returns from live rather than service excellence found elsewhere.
Evolution is dependent on its 5 biggest customers as they make up nearly half of total revenues. Commission charges are negotiated on a case-by-case basis, and such operators likely have leverage as to deciding rates. North American customers do not hold as much power as regulation has made it challenging for them to monopolize federally.
5.2.4: Substitutes
Return-to-player (RTP) is a key metric in determining the attractiveness of a gambling-based experience. This measures the percent of an average bet that is returned to players. If a player tends to win €90 for every €100 wagered, the RTP is 90%. This metric has to be high enough to attract and retain end-users, but reasonable as to allow the operator sufficient margin. Live casino, and by extension Evolution, have a built-in advantage as land-based operators must maintain an RTP lower by 15 – 20% to cover fixed costs.
Attractiveness of land-based operators is reliant on the distance between the venue and potential players. Regions such as Asia and Latin America have limited number of casinos which are concentrated in particular regions. The convenience of at-home play is also valued no matter the proximity of a physical casino. The market share of land-based gambling is being eroded and won by its online counterpart.
RNG, while online, is not nearly as customizable as a live casino experience. The core game physics are largely homogenous across brands whereas live casino game variants are limitless in potential.
5.2.5: Competitive Rivalry
Evolution benefits from a serious network effect, where the value of its offering is improved the more its used. Being a monopoly, Evolution commands most of the end-user base who are able to enjoy gaming with consistent traffic and users no matter the time of day. Evolution has endeavoured to develop games which are not limited by the number of players. Even for traditional games such as blackjack, it produced variants which allow backseat betting and various other ways to engage. As a result, it has exercised considerable operating leverage and secured a large group of players across products.
Finally, pressure to grab market share from competitors is low as the industry is rapidly expanding.
5.3: Regulatory Risks
Evolution serves operators who, while licensed, serve both regulated and unregulated markets. 60% of Evolution’s revenues are attributable to unregulated markets. There remains considerable uncertainty as to what rules incoming governing bodies may decide to impose, and whether they would look to cooperate with the present live casino providers. The hurdles to obtain licenses in such instances may be challenging. This assumes that the incoming body would allow live casino operations to prevail in the first place. There is risk of considerable loss of revenue in an entire jurisdiction. There will also be a loss of tax benefits once gambling levies are enacted.

As more markets are regulated, share of unregulated revenue will decrease. However, the countervailing force is that of higher growth in grey markets. Figure 14 demonstrates the relationship between maturity of regulation in a market and its growth. Currently, Evolution’s fasted growing market, Asia, is also the least regulated.
There also exist continual and persistent direct regulatory threats. Within regulated markets, beyond maintaining gambling licenses, Evolution has to verify the certifications of its operators across all regulated markets. Recently, the Evolution has caught the attention of the UK gambling body which has found unlicensed operators to be offering Evolution’s live services.
In the US, the Wire Act of 1961 has been a source of great uncertainty. Initially, it proscribed interstate sports betting over telecommunications systems, while application to other gambling mediums remained vague. In 2011, the Department of Justice ruled that the act applied only to sports betting, paving the way for legalized online casino operations. 7 years later, it reversed its decision ruling that the act extended over all forms of gambling. This required Evolution to host individual studios across regulated states, incurring significant capital costs.
6: Valuation
6.1: Assumptions
We will pursue a basic discounted cash flow model to approximate intrinsic value. We require forward-looking estimations of:
Cash Tax Rate: Up until 2024, Evolution enjoyed a low cash tax burden of ~ 4%. Regulatory overhauls in Malta have pushed this up a few percentage points as of late. Furthermore, we will assume that markets become more regulated over time bringing additional gambling fees. Hence, a conservative estimate of 10% seems reasonable
Incremental Fixed Capital Investment Rate: Defined as the level of fixed capital investment required to sustain €1 of further revenue (given by net capital expenditure divided by change in revenue for the year, where net capital expenditure equals actual capital expenditure minus depreciation). We can rely only on those historical figures post 2020 given the impact RNG acquisitions have had on product mix. The average has been 27% across 5 years, with a prominent outlier of 52% in 2024. Non-operational factors have had impact here: serious cyber-attacks in Asia and worker union protests in the Georgia studio. The author views these as one-time soluble problems with minimal long-term influence, and hence a moderate 30% may suffice.
Incremental Working Capital Investment Rate: Historically, the figure has been 3 – 4% with fluctuation in the years of acquisition. There is no reason for us to change this figure as we don’t expect the working capital rate to change significantly. Furthermore, as firms mature, their working capital management improves given scale of purchases and negotiating power. Hence, we will stick with 4%.
Operating Margin: As regulation subsumes grey markets and we see expansion in more developed regions, we must expect a reduction in margins to some degree. Evolution’s highest margins are earnt in Asia, and the lowest in North America. However, the former is its most unstable region while the latter among the more stable. We must take this into account and employ a margin appropriately lower than historical highs such as 60%.
Sales Growth Rate: While Evolution has grown beyond the market and gained share, we can reliably assume the industry monopoly will grow with the market over the next few years. The author has employed a dynamic approach where revenue is projected at the weighted average of Live and RNG based on their respective share of revenue for the year, over the next several years. This yields a CAGR of 10.8%.
While the forecast period requires less estimation, it is key in approaching a reliable estimate of value. We must ask for how long we expect Evolution to create value beyond its hurdle rate before the market is saturated and rife with competition. Give its excessive market share of 70%, its specialized focus on Live, and excellent track record, the author proposes 10 years.
Finally, we must fine tune our assumptions for the terminal value calculation. Mature firms often take on more debt to leverage their return on equity. Hence, we can assume a higher D/E ratio. Evolution’s cost of debt is much lower than its cost of equity. This altered capital structure implies our WACC will decrease. Furthermore, we must recalculate our weighted equity risk premium based on projected share of revenue per geographic region. Expansion into both stable markets such as North America and unstable markets such as Asia will have converse impact on the cost of equity. A recalculation based on these assumptions yields a WACC of 9.12%. Then we have the growing perpetuity calculation:

We are assuming therefore that Evolution possesses the pricing power to pass on inflationary costs to operators.
6.2: DCF & Intrinsic Value
Figure 15 exemplifies the discounted cash flow model dictated by our assumptions above.

By the end of 2025, the implied intrinsic value is roughly €106 per outstanding share on a diluted basis. This is considerably higher than the price of €75 at which the stock currently trades. In fact, shares of Evolution are trading at a historically low 12.5 P/E ratio. Here are the reasons why:
Evolution grew revenues at astronomical rates during the two COVID years. This pushed the share up to P/E ratios as high as 90. This run did not continue for long, and investors were quick to sell.
Asia, the most promising segment, has seen no growth over the past two quarters due to persistent cyber-attacks.
There was considerable turmoil at Evolution’s Georgia studio in 2024 where workers protested against working conditions and wages. The studio’s capacity to serve was reduced to 60% and earnings fell short of guidance.
Management issued guidance for 2025 EBITDA margins a couple percentage points lower than historical averages, owing to capital expenditure in North America and investment in security against future cyber threats.
The UK gambling body is investigated Evolution’s licenses in the region due to several unpermitted operators employing their games. The country accounts for ~3.5% of revenue.
Conventional wisdom suggests that the best time to invest in companies is when they area facing short-term soluble problems. Investors are often overly apprehensive about future prospects and deflate the price to well below intrinsic value. Despite that, we must account for uncertainty and estimation/analysis error. In this case, the margin of safety on our estimated value is 41%.
Comments